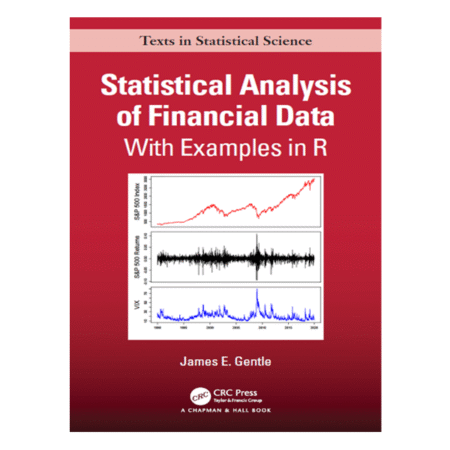
Statistical Analysis of Financial Data: With Examples In R by James Gentle using exploratory data analysis to illustrate the nature

2,864.00

PDF PRINTED BOOK
BLACK & WHITE
Paperback, 666 PAGES Edition 2021
Delivery All Over Pakistan Charges Will Apply.

Title May Be Different.
Due to constant currency fluctuation, prices are subject to change with or without notice.

Categories: , Tags: , , , , , , , , , , , , , , , , , , , , , , , , , , , , , , , , , , , , , , , , , , , , , , , , , , , , , , , , , , , , , , , , , , , , , , , , , , , , , , , , , , , , , , , , , , , , , , , , , , , , , , , , , , , , , , , , , , , , , , , , , , , , , , , , , , , , , , , , , , , , , , , , , , , , , , , , , , , , , , , , , , , , , , , , , ,

Statistical Analysis of Financial Data covers the use of statistical analysis and the methods of data science to model and analyze financial data. The first chapter is an overview of financial markets, describing the market operations and using exploratory data analysis to illustrate the nature of financial data. The software used to obtain the data for the examples in the first chapter and for all computations and to produce the graphs is R. However discussion of R is deferred to an appendix to the first chapter, where the basics of R, especially those most relevant in financial applications, are presented and illustrated. The appendix also describes how to use R to obtain current financial data from the internet.

Reviews

There are no reviews yet.

Be the first to review “Statistical Analysis of Financial Data: With Examples In R by James Gentle using exploratory data analysis to illustrate the nature”

Your email address will not be published. Required fields are marked *